The Mw7.3 Landers, California earthquake occurred on June 28, 1992 (USGS page). It is known for a number of interesting features including significant foreshocks and a complex multifault rupture. I was very much interested the surface rupture pattern and had the good fortune of responding quickly to the event with Dallas Rhodes as well as my fellow graduate students. To be there right after the event (in the rather hot summer Mojave Desert) was very exciting. We worked along the Emerson Fault (northern portion of the rupture).
Many colleagues studied the event and lots of cool and important papers were written. I won't summarize all here. I will link to a few and mostly emphasize our geomorphic studies of the rupture along the Emerson Fault.
The main summary paper put together shortly after the event is Sieh, et al., 1993.
A structural interpretation of the Emerson Fault deformation is in Aydin and Du, 1995.
The McGill and Rubin, JGR, 1999 paper is really cool with some pretty mapping, data synthesis and some cautions about interpreting single event offset data among other things. Here is a video panning along their rupture map:
Our detailed fracture mapping has not been published in detail. I summarize some of what we did logistically in this document about surveying (scroll to the end). Here is a compilation of the mapping (click to see bigger):
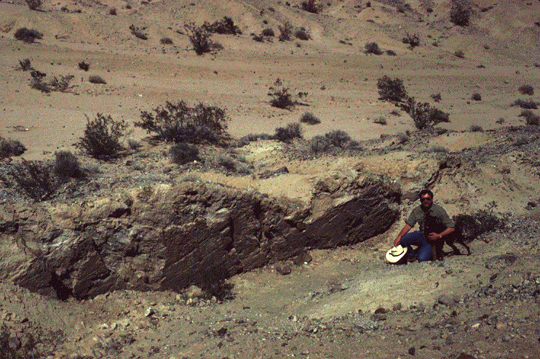
Dallas Rhodes and I were really interested in the potential to study the original forms and initial and ongoing modifications to the remarkable scarp that formed along the Emerson Fault. We set up a survey network and took many pictures along the rupture. We have revisited the site many times over the years to resurvey, describe, and photograph. A description of the initial changes was the first chapter of my dissertation and my first published paper as first author: Arrowsmith and Rhodes, Bulletin of Seismological Society of America, 1992. Here is a link to a series of annotated photographs in which I wondered if there were multiple senses of motion along the fault surface. Here are some kite photos of the site in 1998. In 2008, we laserscanned the site. Those data are also among the Terrestrial Laser Scanner data on OpenTopography. And, in 2012, we flew some cameras from a balloon over the site and were able to produce some nice 3D models:
The Black Canyon City landslide (BCL) is a spectacular deep seated structure located northeast of Black Canyon City, Arizona. It does not appear to pose much harm to structures etc. but it is an interesting feature worthy of study. Such examinations are useful for understanding the geologic setting under which they develop (in this case bedded Tertiary rocks and good local relief), appreciating the potential contributions to the landscape evolution in the area with a similar setting, and for characterizing the underlying structural processes.
Figure 1. Google maps of the Black Canyon City landslide area.
I was first introduced to the BCL in the late 90s by Nick Priznar from Arizona Department of Transportation and then Phil Pearthree (Arizona Geological Survey) and I taught an Advanced Field Geology class together with one weekend focused on it. Lee Amoroso (USGS) also contributed significantly I subsequently used it in Geomorphology courses over the years (e.g., picture of group having lunch in crestal graben). Link to old pages. David Haddad worked for AZGS and contributed to mapping the quadrangle that contains the BCL: Ferguson, C.A., Haddad, D.E., Johnson, B.J., Guynn, J.H., Spencer, J.E., and Eddy, D.L., 2008,
Geologic map of the east half of the Black Canyon City 7 ½' Quadrangle and the west half of the
Squaw Creek Mesa 7 ½' Quadrangle, Maricopa and Yavapai Counties, Arizona: Arizona Geological
Survey Digital Geologic Map DGM-64, 1 sheet, scale 1:24,000, with 27 p. text.
Hurien Helmi is working with me on an M.S. degree and he has chosen to focus on the BCL which should be really great! As part of Hurien's work, we have wanted to produce high resolution maps of the BCL. Hurien has done some work with our balloon systems, but the BCL is in a fairly windy place and thus it has been a bit of a struggle to get good results. Yesterday, we went to the BCL with Professor Srikanth Saripalli our SESE colleague and flew a drone there with good results (hence the topic of this blog entry). I want to summarize the results of the Structure from Motion results from the trip. Stay tuned for Hurien's careful work. This effort is also part of a project with JPL colleagues exploring the power of structure from motion with applications to topographic mapping from space (GAZING).
Sri bought a new DJI Phantom 2 Vision Plus and we used it along with the PIX4D app running on his phone. It worked quite well in that we were able to fly for effectively 15 minutes on each of two batteries (about 10 minutes of mapping time--as indicated in the app).
Figure 2. Overview of the three missions presented as hillshades computed from 0.1 m per pixel digital surface models.
Along with the field acquisition challenge, I wanted to see the differences in results from two main pieces of Structure from Motion software: PIX4D--for which Sri has a license--and Agisoft Photoscan--with which my students and I have more experience (and for which we have a license). In this presentation, I will only show the results from Agisoft Photoscan given their cursory nature. I computed 3D models and present short videos of the texture mapped meshes from Photoscan below as well as a few screen captures. Very importantly, the 3D georeferencing only comes from the GPS tags in the original jpgs from the Phantom!. In addition, I computed digital surface models (DSM) from the models and exported 10 cm versions as geotiffs which I loaded into ArcMap and computed hillshades and cut a few topographic profiles. Aside from the topographic tilt and some other georeferencing issues, the results are impressive for a relatively low amount of effort. It seems that the software can manage the fisheye lens view from the Phantom's camera.
Mission 1 (10 minute flight 80 m above launch point): We covered the toe area of the slide in mission 1. The results are pretty good aside from a gap in the coverage.
Figure 3. Mission 1 overview. Camera positions are indicated as blue rectangles (used). The "lawnmower patter" is evident.
Figure 4. Mission 1 texture map 3D view.
3D visualization of mission 1 coverage
Mission 2 (4 minute flight 40 m above launch point): We made a small flight over the toe area where there are clear fault scarps associated with deformation of the slide (as well as significant fissuring and collapse features).
Figure 5. Mission 2 overview. Camera positions are indicated as blue rectangles.
3D visualization of mission 2 coverage
Figure 6. Toe area DSM. Topographic model shows toe scar well but the whole model has a northwestern tilt due to the simple GPS control on the images for georeferencing.
Mission 3 (11 minute flight 80 m above launch point which is only about 20 or so meters above the upper portion of the slide): We moved up to the slide body and flew over the extensional system at the head of the slide. Note some images were not used (dots in the camera locations from Photoscan)
Figure 7. Mission 3 overview. Camera positions are indicated as blue rectangles or dots (not used?).
Figure 8. 3D views over textured mesh of upper portion of slide.
3D visualization of mission 3 coverage
Figure 9. Upper portion of the slide DSM. Extensional features are quite evident with 10 m deep troughs. Georeferencing is ok.
In the mid 2000s, I worked a lot in the Tien Shan of Kyrgyzstan with numerous colleagues and friends including Andrey Korjenkov, Ernes Mamyrov, Irina Povolotskaya, Chris Crosby, and Benny Guralnik. These were great times. Benny had joined my team for a summer and we worked together in California and in central Asia. He was a great member of our group: so friendly and also so smart and motivated. He also is a very generous person.
Benny and me in the Tien Shan
Benny went on to do his Ph.D. at the Department of Earth Sciences, ETH, Zürich, Switzerland. He has completed his work and now has a new paper out in Earth and Planetary Science Letters : Some like it hot http://www.sciencedirect.com/science/article/pii/S0012821X15002812 - new method enables to reconstruct underground temperatures on timescales of human activity (10,000-100,000 years) and could potentially contribute to better use of geothermal energy, or to safety assurance of nuclear waste disposal. Article OSL-thermochronometry of feldspar from the KTB borehole, Germany.


